You can bring data to life by inserting charts in your templates.
Supported chart types
iText DITO supports creation of these chart types:
-
line chart
-
column chart
Inserting charts
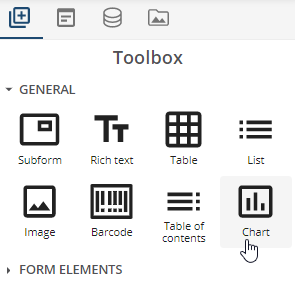
Start chart wizard
To insert a chart, locate the chart tool in the tool box. It will activate the chart wizard and insert a chart placeholder at cursor position in the canvas.
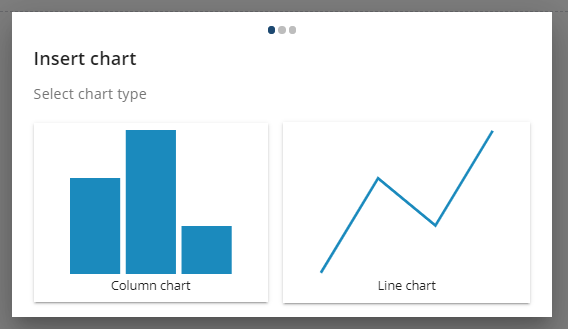
Select chart type
In the wizard, you first select the type of chart you want to insert.
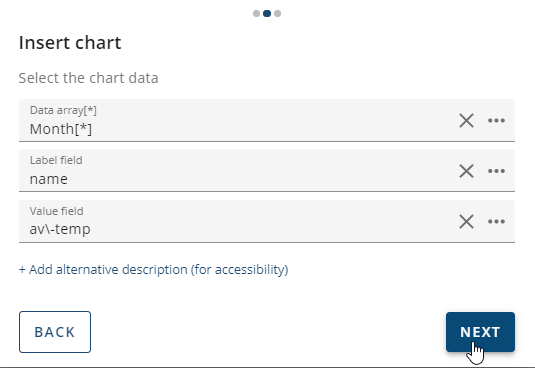
Select chart data
Next you select the data that should populate the chart. There are three data points that are required to create a chart:
-
an array that contains the data you wish to include in the chart (e.g. and array of monthly weather data measurements);
-
a field within the array that contains the labels (X-axis value) (e.g. the name of each month)
-
a field within the same array that contains the values that correspond with the labels (Y-axis value) (e.g. the average temperature in each month
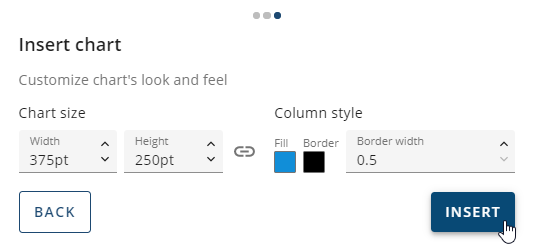
Set chart preferences
Finally, you can set formatting options for the chart, such as line, column or border colors and size of the chart.
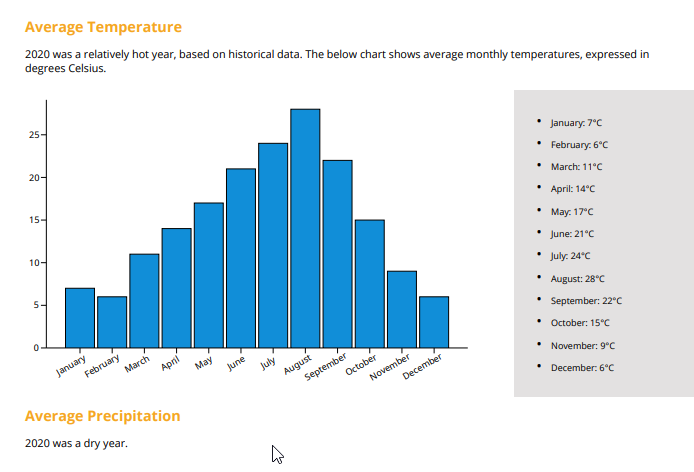
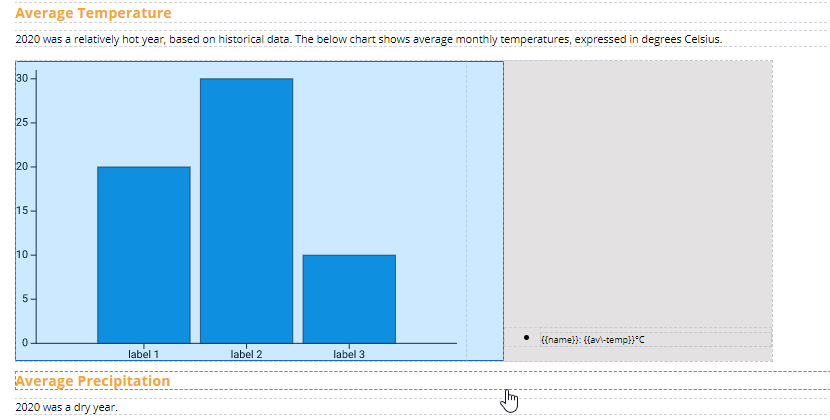
Viewing the chart
In edit mode, the canvas will show a placeholder for the chart based on dummy data. Preview your template to see the chart with relevant sample data.
Edit mode
Preview mode